A look under the surface of Jordan Pond
High-frequency data from the Jordan Pond buoy and weather station are used to understand recent and long-term trends in water quality. Take a look at some visualizations made with these data from the 2017 field season!
Figure 1. Thermal plot of Jordan Pond, Summer 2017.
From May to November, the temperature profile of Jordan Pond shows remarkable changes. Jordan Pond is a dimictic lake, which means it mixes twice a year, in the spring and in the fall. During the summer, the lake thermally stratifies as the surface waters warm. The top layer of warm water, called the epilimnion, is less dense than cooler, deeper water known as the hypolimnion. The zone of rapid temperature change between the epilimnion and hypolimnion is called the thermocline, or metalimnion.
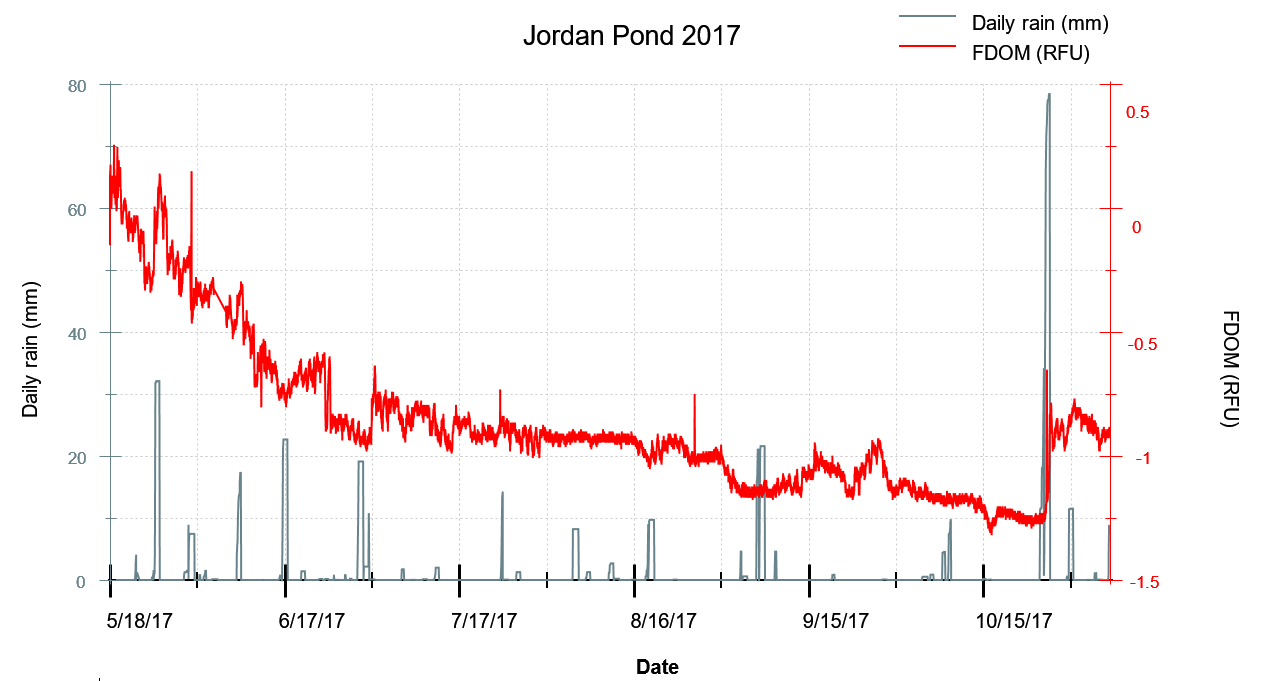
Figure 2. Daily rainfall and FDOM measurements from the 2017 ice-free season.
Fluorescent dissolved organic matter (FDOM) can be used as a proxy for dissolved organic carbon (DOC), which influences the water clarity in Jordan Pond. Autochthonous DOC is generated within the lake by photosynthetic algae and/or aquatic vegetation, while allochthonous DOC is produced on the landscape as a result of decomposition of organic matter. Allochthonous DOC can be transported from the landscape to Jordan Pond by run-off during or after rainfall. While many factors can contribute to FDOM, this figure shows how rainfall events can increase FDOM levels in Jordan Pond—note the jump in FDOM during the late-October storm, which dropped over 3 inches of rain!
Figure 3. Temperature, dissolved oxygen, and chlorophyll measurements from the Jordan Pond surface water during the 2017 ice-free season.
Chlorophyll is an indicator of phytoplankton biomass. Phytoplankton perform photosynthesis, producing dissolved oxygen in the process. While other factors can also affect dissolved oxygen levels in lakes, chlorophyll and dissolved oxygen are often closely linked. Additionally, as temperature of the surface waters increase, the water can hold less dissolved oxygen.


